- 부모 세대 대비 현세대 삶 평가, 다음 세대 삶 전망 - Gallup International 다국가 조사 #75주년
- 조사일 : 2022/10/31
- [GallupReport(20230215)_Life_GIA75.pdf] 다운로드
● 2023년 2월 15일(수) 공개 | 문의: 02-3702-2571/2621/2622
현세대 삶 평가, 다음 세대 삶 전망 - Gallup International 75주년 다국가 조사
→ 한국+세계 조사 결과 파일 다운로드(PDF)
/ 세계 조사 개요
- 2022년 8~10월 63개국 성인 총 60,219명 전화/온라인/면접조사(주제별 참여국 상이)
/ 한국 조사 개요
- 조사기간: 2022년 8월 23~31일
- 표본추출: 사회연구패널★에서 성·연령·지역별 층화 추출
(한국갤럽이 무선전화 RDD 방식으로 구축·운영하는 확률 기반 조사패널)
- 응답방식: 모바일조사(조사대상자에게 문자메시지 발송, 자기기입식 웹조사)
- 조사대상: 전국 만 19~79세 1,035명
- 표본오차: ±3.0%포인트(95% 신뢰수준)
- 문자 발송 대비 응답 완료율: 46%(총 2,263명 중 1,035명)
- 의뢰처: 한국갤럽-Gallup International 자체 조사
/ 조사 항목(아래 순서대로 질문)
- 부모 세대 대비 현세대 삶 평가
- 현세대 대비 다음 세대 삶 전망
(※ 세계 조사 상세 결과는 첨부 파일 참조)
요약
- 63개국 시민 중 51% '나의 삶은 부모 세대보다 좋은 편', '나쁜 편' 23%
/ 부모보다 나은 삶 평가, 다음 세대 낙관 전망 최상위권은 대체로 신흥국
/ G7 등 전통적 경제 강국들은 중하위권, 기저 효과·저출생·고령화 영향 추정
- '요즘 어린이들의 삶은 나보다 좋아질 것' 44%, '나빠질 것' 28%
/ 63개국 중 3분의 1, 다음 세대 삶 전망에서 낙관론보다 비관론 많아
/ 오랜 군사적 분쟁, 정치 불안정, 코로나19 팬데믹 등 국가별 상황 제각각
- 한국인은 저연령일수록 미래 세대 삶 전망 비관적
/ 젊은이들이 결혼과 양육 꺼리는 현상과 일맥상통
조사 결과
2022년 8~10월 63개국 시민 51%
'나의 삶은 부모 세대보다 좋은 편', '나쁜 편' 23%
- '요즘 어린이들의 삶은 나보다 좋아질 것' 44%, '나빠질 것' 28%
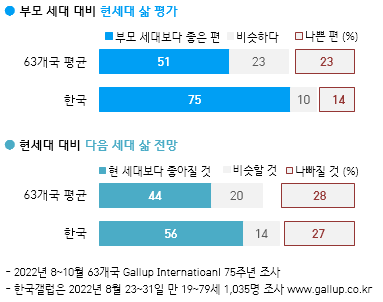
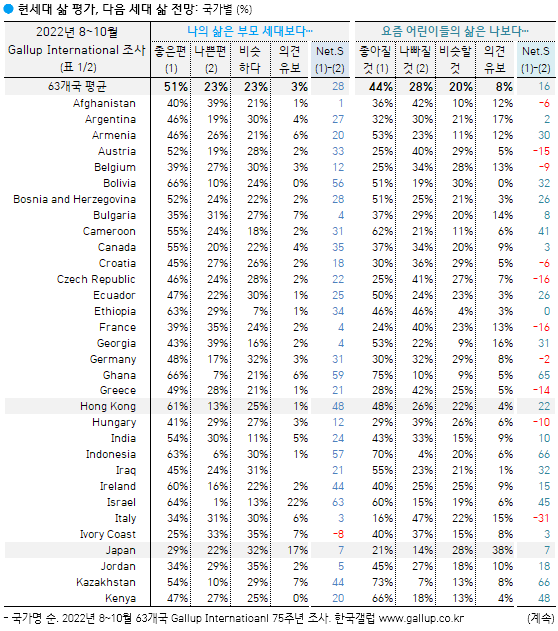
갤럽 인터내셔널이 2022년 8~10월 63개국 시민 60,219명에게 부모 세대에 비해 자기 삶이 전반적으로 어떠하다고 느끼는지 물었다. 그 결과 51%가 '부모 세대보다 좋은 편', '나쁜 편', '비슷하다'라고 답한 사람이 각각 23%였고, 3%는 의견을 유보했다. 한편, 요즘 어린이들의 삶은 자신에 비해 전반적으로 어떠할 것이라고 보는가 하는 물음에는 '좋아질 것' 44%, '나빠질 것' 28%, '비슷할 것' 20%, 의견 유보 8%로 나타났다. 즉, 다음 세대가 자신만큼 부모보다 더 나은 삶을 살게 되리란 기대는 덜하다고 볼 수 있다.
──
'부모 세대보다 나은 삶' 응답 많은 나라:
나이지리아·코소보 80%대, 한국·UAE 70%대
- 주요국: 미국 60%, 러시아·독일 48%, 프랑스·이탈리아 30%대, 일본 29%
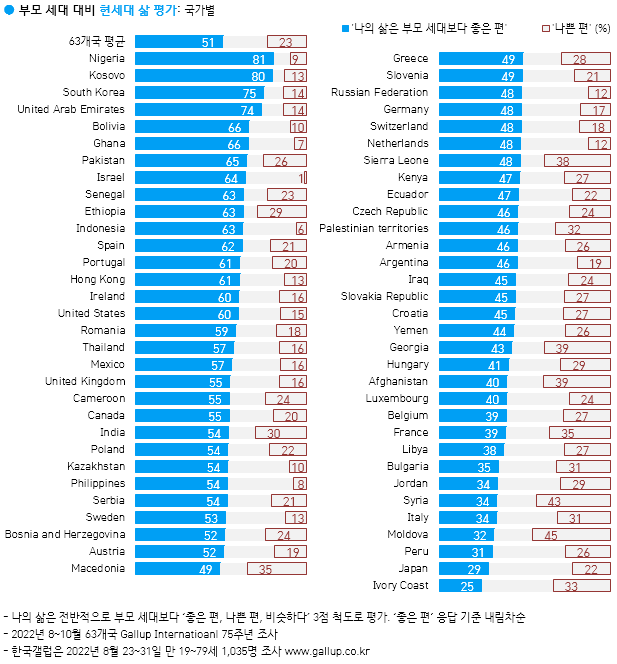
현세대 삶을 가장 긍정적으로 평가한 나라는 나이지리아다. 나이지리아 시민 81%가 자신의 삶이 부모 세대보다 좋은 편이라고 답했고, 코소보(80%), 한국(75%), 아랍에미리트(UAE, 74%) 등에서도 그 비율이 70%를 넘었다. 그 외 주요국을 보면 미국 60%, 영국·캐나다 55%, 러시아·독일·스위스 등이 48%, 프랑스 39%, 이탈리아 34%, 일본 29%다.
◎ 현세대 삶 긍정 평가 최상위는 대체로 신흥국들이 차지했고, G7 등 전통적인 경제 강국들은 중하위권에 속했다. 그런 나라들은 정치·안보 측면에서 여전히 큰 힘을 발휘하고 있으나, 자국민이 느끼는 삶의 질 측면에서는 체감 개선 정도가 상대적으로 낮았다. 일찍이 선진국 반열에 올라 오래전부터 생활수준이 높았고, 더 향상하기는 어려운 일종의 기저 효과가 작용한다고도 볼 수 있겠다. 63개국 전반적인 응답자 특성에서는 교육 수준, 소득 수준이 높을수록 자신의 삶이 부모 세대보다 좋은 편이라고 평가한 사람이 많았다.
──
'요즘 아이들 삶 더 좋아질 것' 응답 많은 나라:
나이지리아 90%, 코소보 82%, UAE·가나·카자흐스탄·예멘·인도네시아 70%대
- 주요국: 한국·러시아 50%대, 미국 43%, 영국·독일 30%대, 프랑스·일본 20%대, 이탈리아 16%
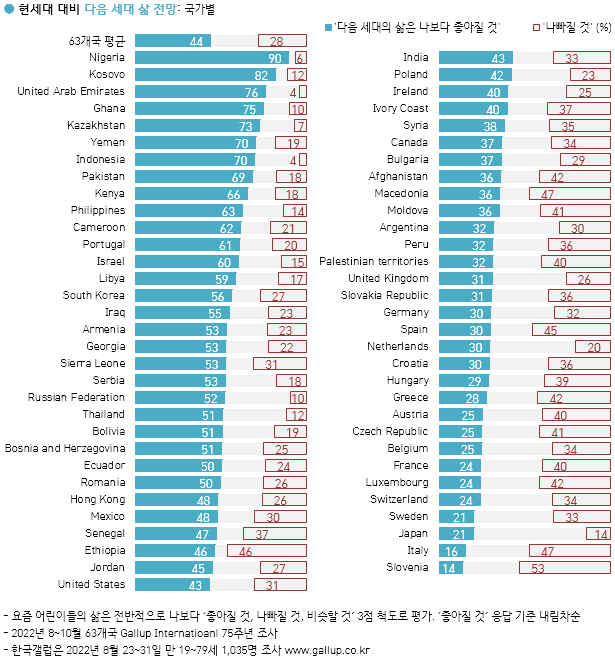
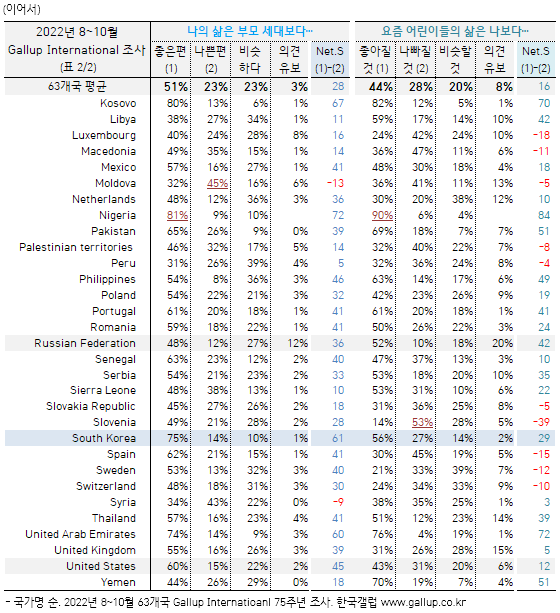
다음 세대의 삶을 가장 밝게 전망한 나라는 나이지리아다. 나이지리아 시민 90%가 요즘 어린이들의 삶이 자신보다 좋아질 것이라고 답했고, 코소보에서는 82%, 아랍에미리트(76%), 가나(75%), 카자흐스탄(73%), 예멘과 인도네시아(70%)에서도 70%대를 기록했다. 그 외 주요국을 보면 한국 56%, 러시아 52%, 미국 43%, 캐나다 37%, 영국 31%, 독일 30%, 프랑스 24%, 일본 21%, 이탈리아 16%다.
◎ 다음 세대 삶 낙관 전망 최상위 역시 대부분 신흥국이지만, 한국은 다소 뒤처진 15번째에 자리했다. 63개국 전반적인 응답자 특성으로 보면 젊은이들이 고령층보다 다음 세대 삶을 낙관적으로 봤다.
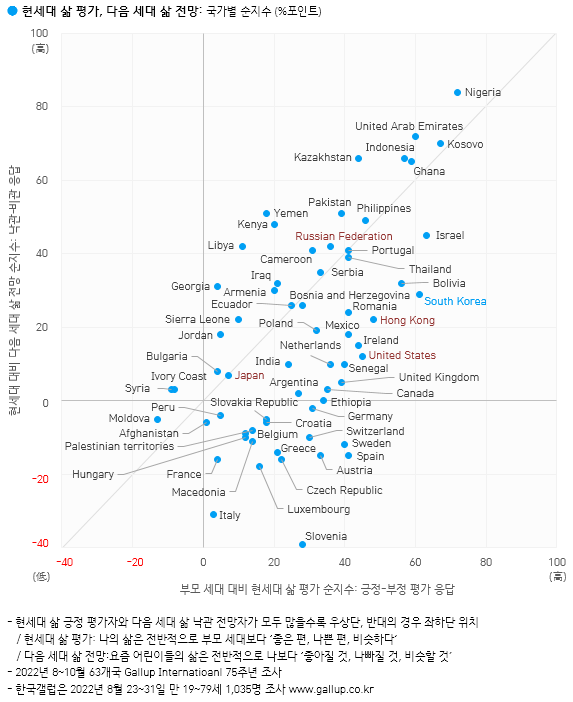
◎ 선행 질문인 부모 세대 대비 현세대 평가에서는 63개국 중 단 세 나라에서만 긍정론보다 부정론이 많았다(몰도바, 시리아, 아이보리코스트). 그러나, 현세대 대비 다음 세대 삶 전망에서는 셋 중 한 나라에서 낙관론보다 비관론이 앞섰다. 슬로베니아 시민 53%가 요즘 아이들의 삶이 자기보다 나빠질 것이라고 답했고, 마케도니아·이탈리아(47%), 에티오피아(46%), 스페인(45%), 아프가니스탄·그리스·룩셈부르크(42%) 등에서도 절반에 가까운 시민이 다음 세대 삶에 대해 비관적이었다. 오랜 군사적 분쟁, 정치적 불안정, 코로나19 팬데믹 타격, 기후 위기 등 각국이 처한 상황은 제각각이다.
──
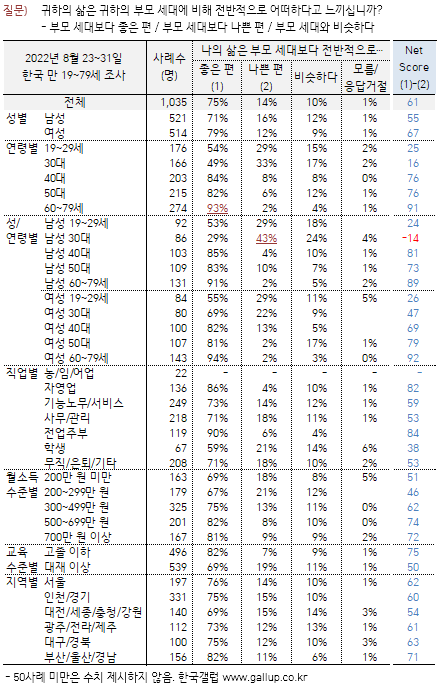
한국인은 고연령일수록 부모보다 나은 삶 평가, 미래 세대 삶 전망도 더 낙관적
- 20·30대 절반가량 '부모보다 좋은 편'... 40대 이상에서는 80% 웃돌아
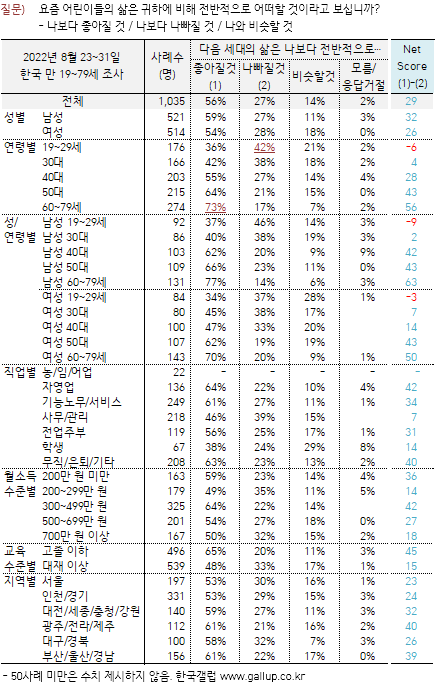
- 20·30대 40% 내외 '아이들 삶 나보다 더 좋을 것'... 60·70대 73%
우리나라는 지난 세기 일제 강점기, 한국전쟁, 분단과 이산, 고도 성장기와 독재, 민주화, 외환 위기를 겪었고, 21세기 들어서는 기술적·문화적 측면에서 글로벌 경쟁력이 급성장했다. 신흥국과 선진국의 기로에 선 만큼, 한국인 넷 중 세 명은 부모 세대보다 더 나은 삶을 살고 있다고 평가하며 고연령일수록 그 비율이 더 높다: 20·30대 50% 내외, 40·50대 80%대, 60·70대 93%. 성·연령별로 보면 30대 남녀 간 차이가 두드러진다. 30대 남성은 43%가 부모 세대보다 자기 삶이 더 나빠졌다고 답했으나, 30대 여성은 69%가 좋아졌다고 평가했다.
◎ 다음 세대 삶 전망에서도 한국인은 고연령일수록 더 낙관적이다: '아이들 삶이 나보다 더 좋을 것' 20·30대 40% 내외, 40대 55%, 50대 64%, 60·70대 73%. 20대의 42%, 30대의 38%는 비관적이다. 이처럼 젊은이들이 미래 아이들의 삶을 밝게 보지 못하는 점은 결혼과 양육을 꺼리는 현상과도 맥을 같이한다.
──────────────────
Do we live better than our parents?
And what about our children?
──────────────────
Every second citizen (51%) of the world believes that their life is better than that of their parents. The other half of the people asked is equally divided between those who assess a worse life (23%) and those who find it the same (23%). 3% could not answer. Satisfaction with the living standard is a key factor for people to believe that they have a better life than their parents. But in some rich regions like Europe this is not so valid.
Expectations for the life of today’s children are predominantly good as well but lower than the comparison of own life to the life of the previous generation – 44% are expecting a better life for today’s children in comparison to our lives, 28% expecting a worse life, 20% expecting about the same and 8% not responding. Aged people are less sure about the better future of the next generation. More money unsurprisingly seems to result in more confidence in the future on a personal level, but on national level countries that experience or used to experience difficulties are the ones to believe stronger in better future for the next generation. Unsurprisingly again.
This is the picture from the special poll conducted by Gallup International Association (GIA) in 63 countries covering over two thirds of the global population (and more than 90% of those countries which are free to conduct and publish opinion research). The poll celebrates GIA’s 75th anniversary.
When asked if they now have, overall, a better, worse, or roughly similar life compared to that of their parents, globally 51% report a better life, 23% worse, 23% about the same, with 3% not answering (Refused or Don’t Know). When rounded, globally there is nearly 30 points spread between positive and negative views on the inter-generational trend in wellbeing.
The most positive country among the 63 is Nigeria – 81% choosing “better” and 9% choosing “worse” that makes 71 points spread. And the most negative is Moldova (32% “better” but 45% “worse” forming a negative spread of -13 points).
By region, in terms of spreads, the trend seems most positive in East Asia/Oceania (55% “better”, 13% “worse” or 42 points), followed by North America (58% “better”, 17% “worse”), Sub-Saharan Africa and South-Asia (56% “better”, 24% “worse” and 60% “better”, 28% “worse” – equal spreads though different shares). Then comes Latin America (47% “better”, 19% “worse”), Europe (49% “better”, 22% “worse” with nearly the same spreads of 27 and 26 points for both EU and non-EU European countries) and the Middle East – North Africa (47% “better”, 25% “worse”). West Asia represented by Afghanistan serves as an outlier with only 1 point (40% “better”, 39% “worse”).
Among the most prominent countries where GIA was able to conduct the survey, ranked by the spread between “better” and “worse” positive results are highest in Nigeria (81% “better” vs 9% “worse”), the USA (60% “better”, 15% “worse”), Mexico (57% “better”, 16% “worse”), Russia (48% “better”, 12% “worse”) and India (54% “better”, 30% “worse”).
As we would expect, results vary across groups defined in terms of household income, education etc. For instance, lowest household income groups reveal positive assessments, but these are rather low (42% “better”, 29% “worse” or 13 points) compared to groups with highest quality of life (62% “better”, 16% “worse”). Most educated people are more positive (33 points) than less educated people (16 points) too. Despite this general pattern results prove to be country-specific, depending on various historical contexts, etc.
When asked about today’s children lives, compared to our lives, opinions globally were marginally less positive, with 44% expecting a better life for their children, 28% expecting a worse life, 20% expecting about the same and 8% not responding. Thus, across the globe, there is a 16-point spread between positive and negative expectations about the lives of children today. Expectations for the generation seem less positive than comparison to the previous one. However, given all of the challenges we are facing (war, inflation, pandemics, climate change) this level of positive expectation is a kind of a positive surprise.
The older the respondents, the less sure they are on today’s children prospects. For instance, in the 55+ age group the structure is as follows: 39% “better” minus 31% “worse” and a relatively small spread – compared to a significant 22-point spread (48% vs 26%) within under 35 age group. Due to intergenerational dialogue problems, concerns for tomorrow’s world or whatever, there seem to be a gap between past and future in the older generation’s opinion.
The richer seem to be more confident in the future they can provide for their children (24 points in the highest income strata) than the poorer ones (11 points in the lowest income group strata). But on the other hand, it is the developing countries which are the ones with better hope – not the richest ones. This is not without exceptions of course. Apparently, a positive trend of developing is more important than having an appropriate standard. That is probably why expectations of the future are strongest (measured by the spread between positive and negative expectations) in East Asia/Oceania (34 points; 50% “better”, 16% “worse”), followed by non-EU Europe and Sub-Saharan Africa (both at 32 points: 54% “better”, 22% “worse” for non-EU Europe; 59% “better”, 27% “worse” for Sub-Saharan Africa), South Asia (30 points; 56% “better”, 25% “worse”), MENA (28 points; 52% “better”, 24% “worse”), Latin America (11 points; 40% “better”, 29% “worse”), North America (8 points; 40% “better”, 32% “worse”), the EU (-4 points; 30% “better”, 34% “worse”) and West Asia (-5 points; 36% “better”, 42% “worse”).
The most positive country among those surveyed is Nigeria (90% minus 6%) and the most negative is Slovenia a (14% minus 53%). Among the prominent countries where GIA could poll, expectations for their children’s future are highest in Nigeria is followed by Russia (52% minus 10%), Mexico (48% minus 30%), the USA (43% minus 31%) and India (43% minus 33%).
When combining the two questions, another perspective is added. For instance, Moldova shows a total of 86 (45% saying that their live is worse life than the one of their parents plus 41% expecting a worse life of today’s children), followed in this negative ranking by North Macedonia (82: 35% negative assessments plus 47% negative predictions), Afghanistan (81), Syria and Italy (78), etc.
Most of the countries are still positive on both questions, but if one looks for instance for countries with both above 50% positive answers, Nigeria stands out with 171 (81% positive for today plus 90% positive for tomorrow), followed by Kosovo (162), the United Arab Emirates (150), Ghana (141), Pakistan (134), etc.
Findings are proved, confirming that developing parts of the world share more hope. National and political peculiarities leave their footprint but in general is seems that the closer the war and troubles are, the worse are the answers on both issues – as expected.
Kancho Stoychev,
President of Gallup International Association:
“A widespread modern belief suggests that we will live better than the previous generation and that the next one will live better than us. But imagine the opposite: that we live worse than our parents and in addition our kids are going to have a life worse than ours. That means two generations with a declining quality of life. And while such a majority mood looks relatively easy to explain for countries like Afghanistan, Moldova, North Macedonia and Syria, for France and Italy it is a real challenge to do it. But despite the significant difference in the explanations, what is common in both cases is the perception of a life crisis. That is why it seems that the combination of those two questions is mapping the citizens on the scale of actual satisfaction with life in every one of the 63 countries surveyed”.
──
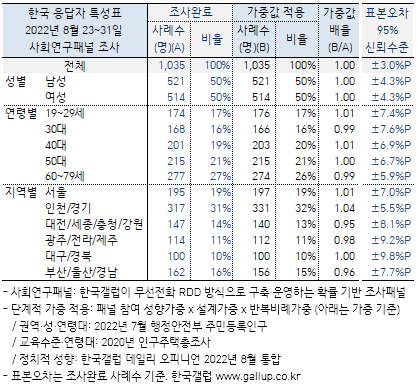
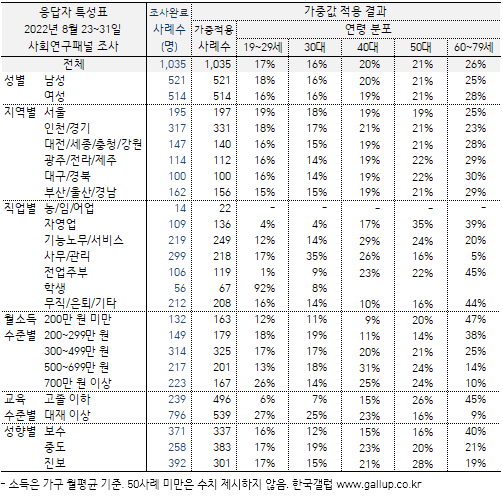
한국 응답자 특성표
| 1947년 조지 갤럽 박사가 설립한 갤럽 인터내셔널(Gallup International Association)은 전 세계 회원사들이 인간 가치관, AIDS, UN 활동, 아프가니스탄 침공, 9.11 테러, 세계 경제 위기, 일본 대지진, 글로벌 리더, 미국 대통령선거 등 주요 현안에 관한 다국가 조사를 해왔습니다. 2022년 가을에는 설립 75주년을 기념하여 63개국 회원사가 공동 조사했습니다. 그 결과는 올해 상반기 몇 차례에 걸쳐 전하고 있는데요. 지난번 〈경제·안보 전략적 파트너〉에 이어, 오늘은 현세대 삶 평가와 다음 세대 삶 전망을 알려드립니다. → Press release for the 120th Anniversary of Dr. George Gallup |
현세대 삶 평가, 다음 세대 삶 전망 - Gallup International 75주년 다국가 조사
→ 한국+세계 조사 결과 파일 다운로드(PDF)
/ 세계 조사 개요
- 2022년 8~10월 63개국 성인 총 60,219명 전화/온라인/면접조사(주제별 참여국 상이)
/ 한국 조사 개요
- 조사기간: 2022년 8월 23~31일
- 표본추출: 사회연구패널★에서 성·연령·지역별 층화 추출
(한국갤럽이 무선전화 RDD 방식으로 구축·운영하는 확률 기반 조사패널)
- 응답방식: 모바일조사(조사대상자에게 문자메시지 발송, 자기기입식 웹조사)
- 조사대상: 전국 만 19~79세 1,035명
- 표본오차: ±3.0%포인트(95% 신뢰수준)
- 문자 발송 대비 응답 완료율: 46%(총 2,263명 중 1,035명)
- 의뢰처: 한국갤럽-Gallup International 자체 조사
/ 조사 항목(아래 순서대로 질문)
- 부모 세대 대비 현세대 삶 평가
- 현세대 대비 다음 세대 삶 전망
(※ 세계 조사 상세 결과는 첨부 파일 참조)
요약
- 63개국 시민 중 51% '나의 삶은 부모 세대보다 좋은 편', '나쁜 편' 23%
/ 부모보다 나은 삶 평가, 다음 세대 낙관 전망 최상위권은 대체로 신흥국
/ G7 등 전통적 경제 강국들은 중하위권, 기저 효과·저출생·고령화 영향 추정
- '요즘 어린이들의 삶은 나보다 좋아질 것' 44%, '나빠질 것' 28%
/ 63개국 중 3분의 1, 다음 세대 삶 전망에서 낙관론보다 비관론 많아
/ 오랜 군사적 분쟁, 정치 불안정, 코로나19 팬데믹 등 국가별 상황 제각각
- 한국인은 저연령일수록 미래 세대 삶 전망 비관적
/ 젊은이들이 결혼과 양육 꺼리는 현상과 일맥상통
조사 결과
2022년 8~10월 63개국 시민 51%
'나의 삶은 부모 세대보다 좋은 편', '나쁜 편' 23%
- '요즘 어린이들의 삶은 나보다 좋아질 것' 44%, '나빠질 것' 28%
갤럽 인터내셔널이 2022년 8~10월 63개국 시민 60,219명에게 부모 세대에 비해 자기 삶이 전반적으로 어떠하다고 느끼는지 물었다. 그 결과 51%가 '부모 세대보다 좋은 편', '나쁜 편', '비슷하다'라고 답한 사람이 각각 23%였고, 3%는 의견을 유보했다. 한편, 요즘 어린이들의 삶은 자신에 비해 전반적으로 어떠할 것이라고 보는가 하는 물음에는 '좋아질 것' 44%, '나빠질 것' 28%, '비슷할 것' 20%, 의견 유보 8%로 나타났다. 즉, 다음 세대가 자신만큼 부모보다 더 나은 삶을 살게 되리란 기대는 덜하다고 볼 수 있다.
──
'부모 세대보다 나은 삶' 응답 많은 나라:
나이지리아·코소보 80%대, 한국·UAE 70%대
- 주요국: 미국 60%, 러시아·독일 48%, 프랑스·이탈리아 30%대, 일본 29%
현세대 삶을 가장 긍정적으로 평가한 나라는 나이지리아다. 나이지리아 시민 81%가 자신의 삶이 부모 세대보다 좋은 편이라고 답했고, 코소보(80%), 한국(75%), 아랍에미리트(UAE, 74%) 등에서도 그 비율이 70%를 넘었다. 그 외 주요국을 보면 미국 60%, 영국·캐나다 55%, 러시아·독일·스위스 등이 48%, 프랑스 39%, 이탈리아 34%, 일본 29%다.
◎ 현세대 삶 긍정 평가 최상위는 대체로 신흥국들이 차지했고, G7 등 전통적인 경제 강국들은 중하위권에 속했다. 그런 나라들은 정치·안보 측면에서 여전히 큰 힘을 발휘하고 있으나, 자국민이 느끼는 삶의 질 측면에서는 체감 개선 정도가 상대적으로 낮았다. 일찍이 선진국 반열에 올라 오래전부터 생활수준이 높았고, 더 향상하기는 어려운 일종의 기저 효과가 작용한다고도 볼 수 있겠다. 63개국 전반적인 응답자 특성에서는 교육 수준, 소득 수준이 높을수록 자신의 삶이 부모 세대보다 좋은 편이라고 평가한 사람이 많았다.
──
'요즘 아이들 삶 더 좋아질 것' 응답 많은 나라:
나이지리아 90%, 코소보 82%, UAE·가나·카자흐스탄·예멘·인도네시아 70%대
- 주요국: 한국·러시아 50%대, 미국 43%, 영국·독일 30%대, 프랑스·일본 20%대, 이탈리아 16%
다음 세대의 삶을 가장 밝게 전망한 나라는 나이지리아다. 나이지리아 시민 90%가 요즘 어린이들의 삶이 자신보다 좋아질 것이라고 답했고, 코소보에서는 82%, 아랍에미리트(76%), 가나(75%), 카자흐스탄(73%), 예멘과 인도네시아(70%)에서도 70%대를 기록했다. 그 외 주요국을 보면 한국 56%, 러시아 52%, 미국 43%, 캐나다 37%, 영국 31%, 독일 30%, 프랑스 24%, 일본 21%, 이탈리아 16%다.
◎ 다음 세대 삶 낙관 전망 최상위 역시 대부분 신흥국이지만, 한국은 다소 뒤처진 15번째에 자리했다. 63개국 전반적인 응답자 특성으로 보면 젊은이들이 고령층보다 다음 세대 삶을 낙관적으로 봤다.
◎ 선행 질문인 부모 세대 대비 현세대 평가에서는 63개국 중 단 세 나라에서만 긍정론보다 부정론이 많았다(몰도바, 시리아, 아이보리코스트). 그러나, 현세대 대비 다음 세대 삶 전망에서는 셋 중 한 나라에서 낙관론보다 비관론이 앞섰다. 슬로베니아 시민 53%가 요즘 아이들의 삶이 자기보다 나빠질 것이라고 답했고, 마케도니아·이탈리아(47%), 에티오피아(46%), 스페인(45%), 아프가니스탄·그리스·룩셈부르크(42%) 등에서도 절반에 가까운 시민이 다음 세대 삶에 대해 비관적이었다. 오랜 군사적 분쟁, 정치적 불안정, 코로나19 팬데믹 타격, 기후 위기 등 각국이 처한 상황은 제각각이다.
──
한국인은 고연령일수록 부모보다 나은 삶 평가, 미래 세대 삶 전망도 더 낙관적
- 20·30대 절반가량 '부모보다 좋은 편'... 40대 이상에서는 80% 웃돌아
- 20·30대 40% 내외 '아이들 삶 나보다 더 좋을 것'... 60·70대 73%
우리나라는 지난 세기 일제 강점기, 한국전쟁, 분단과 이산, 고도 성장기와 독재, 민주화, 외환 위기를 겪었고, 21세기 들어서는 기술적·문화적 측면에서 글로벌 경쟁력이 급성장했다. 신흥국과 선진국의 기로에 선 만큼, 한국인 넷 중 세 명은 부모 세대보다 더 나은 삶을 살고 있다고 평가하며 고연령일수록 그 비율이 더 높다: 20·30대 50% 내외, 40·50대 80%대, 60·70대 93%. 성·연령별로 보면 30대 남녀 간 차이가 두드러진다. 30대 남성은 43%가 부모 세대보다 자기 삶이 더 나빠졌다고 답했으나, 30대 여성은 69%가 좋아졌다고 평가했다.
◎ 다음 세대 삶 전망에서도 한국인은 고연령일수록 더 낙관적이다: '아이들 삶이 나보다 더 좋을 것' 20·30대 40% 내외, 40대 55%, 50대 64%, 60·70대 73%. 20대의 42%, 30대의 38%는 비관적이다. 이처럼 젊은이들이 미래 아이들의 삶을 밝게 보지 못하는 점은 결혼과 양육을 꺼리는 현상과도 맥을 같이한다.
──────────────────
Do we live better than our parents?
And what about our children?
──────────────────
Every second citizen (51%) of the world believes that their life is better than that of their parents. The other half of the people asked is equally divided between those who assess a worse life (23%) and those who find it the same (23%). 3% could not answer. Satisfaction with the living standard is a key factor for people to believe that they have a better life than their parents. But in some rich regions like Europe this is not so valid.
Expectations for the life of today’s children are predominantly good as well but lower than the comparison of own life to the life of the previous generation – 44% are expecting a better life for today’s children in comparison to our lives, 28% expecting a worse life, 20% expecting about the same and 8% not responding. Aged people are less sure about the better future of the next generation. More money unsurprisingly seems to result in more confidence in the future on a personal level, but on national level countries that experience or used to experience difficulties are the ones to believe stronger in better future for the next generation. Unsurprisingly again.
This is the picture from the special poll conducted by Gallup International Association (GIA) in 63 countries covering over two thirds of the global population (and more than 90% of those countries which are free to conduct and publish opinion research). The poll celebrates GIA’s 75th anniversary.
When asked if they now have, overall, a better, worse, or roughly similar life compared to that of their parents, globally 51% report a better life, 23% worse, 23% about the same, with 3% not answering (Refused or Don’t Know). When rounded, globally there is nearly 30 points spread between positive and negative views on the inter-generational trend in wellbeing.
The most positive country among the 63 is Nigeria – 81% choosing “better” and 9% choosing “worse” that makes 71 points spread. And the most negative is Moldova (32% “better” but 45% “worse” forming a negative spread of -13 points).
By region, in terms of spreads, the trend seems most positive in East Asia/Oceania (55% “better”, 13% “worse” or 42 points), followed by North America (58% “better”, 17% “worse”), Sub-Saharan Africa and South-Asia (56% “better”, 24% “worse” and 60% “better”, 28% “worse” – equal spreads though different shares). Then comes Latin America (47% “better”, 19% “worse”), Europe (49% “better”, 22% “worse” with nearly the same spreads of 27 and 26 points for both EU and non-EU European countries) and the Middle East – North Africa (47% “better”, 25% “worse”). West Asia represented by Afghanistan serves as an outlier with only 1 point (40% “better”, 39% “worse”).
Among the most prominent countries where GIA was able to conduct the survey, ranked by the spread between “better” and “worse” positive results are highest in Nigeria (81% “better” vs 9% “worse”), the USA (60% “better”, 15% “worse”), Mexico (57% “better”, 16% “worse”), Russia (48% “better”, 12% “worse”) and India (54% “better”, 30% “worse”).
As we would expect, results vary across groups defined in terms of household income, education etc. For instance, lowest household income groups reveal positive assessments, but these are rather low (42% “better”, 29% “worse” or 13 points) compared to groups with highest quality of life (62% “better”, 16% “worse”). Most educated people are more positive (33 points) than less educated people (16 points) too. Despite this general pattern results prove to be country-specific, depending on various historical contexts, etc.
When asked about today’s children lives, compared to our lives, opinions globally were marginally less positive, with 44% expecting a better life for their children, 28% expecting a worse life, 20% expecting about the same and 8% not responding. Thus, across the globe, there is a 16-point spread between positive and negative expectations about the lives of children today. Expectations for the generation seem less positive than comparison to the previous one. However, given all of the challenges we are facing (war, inflation, pandemics, climate change) this level of positive expectation is a kind of a positive surprise.
The older the respondents, the less sure they are on today’s children prospects. For instance, in the 55+ age group the structure is as follows: 39% “better” minus 31% “worse” and a relatively small spread – compared to a significant 22-point spread (48% vs 26%) within under 35 age group. Due to intergenerational dialogue problems, concerns for tomorrow’s world or whatever, there seem to be a gap between past and future in the older generation’s opinion.
The richer seem to be more confident in the future they can provide for their children (24 points in the highest income strata) than the poorer ones (11 points in the lowest income group strata). But on the other hand, it is the developing countries which are the ones with better hope – not the richest ones. This is not without exceptions of course. Apparently, a positive trend of developing is more important than having an appropriate standard. That is probably why expectations of the future are strongest (measured by the spread between positive and negative expectations) in East Asia/Oceania (34 points; 50% “better”, 16% “worse”), followed by non-EU Europe and Sub-Saharan Africa (both at 32 points: 54% “better”, 22% “worse” for non-EU Europe; 59% “better”, 27% “worse” for Sub-Saharan Africa), South Asia (30 points; 56% “better”, 25% “worse”), MENA (28 points; 52% “better”, 24% “worse”), Latin America (11 points; 40% “better”, 29% “worse”), North America (8 points; 40% “better”, 32% “worse”), the EU (-4 points; 30% “better”, 34% “worse”) and West Asia (-5 points; 36% “better”, 42% “worse”).
The most positive country among those surveyed is Nigeria (90% minus 6%) and the most negative is Slovenia a (14% minus 53%). Among the prominent countries where GIA could poll, expectations for their children’s future are highest in Nigeria is followed by Russia (52% minus 10%), Mexico (48% minus 30%), the USA (43% minus 31%) and India (43% minus 33%).
When combining the two questions, another perspective is added. For instance, Moldova shows a total of 86 (45% saying that their live is worse life than the one of their parents plus 41% expecting a worse life of today’s children), followed in this negative ranking by North Macedonia (82: 35% negative assessments plus 47% negative predictions), Afghanistan (81), Syria and Italy (78), etc.
Most of the countries are still positive on both questions, but if one looks for instance for countries with both above 50% positive answers, Nigeria stands out with 171 (81% positive for today plus 90% positive for tomorrow), followed by Kosovo (162), the United Arab Emirates (150), Ghana (141), Pakistan (134), etc.
Findings are proved, confirming that developing parts of the world share more hope. National and political peculiarities leave their footprint but in general is seems that the closer the war and troubles are, the worse are the answers on both issues – as expected.
Kancho Stoychev,
President of Gallup International Association:
“A widespread modern belief suggests that we will live better than the previous generation and that the next one will live better than us. But imagine the opposite: that we live worse than our parents and in addition our kids are going to have a life worse than ours. That means two generations with a declining quality of life. And while such a majority mood looks relatively easy to explain for countries like Afghanistan, Moldova, North Macedonia and Syria, for France and Italy it is a real challenge to do it. But despite the significant difference in the explanations, what is common in both cases is the perception of a life crisis. That is why it seems that the combination of those two questions is mapping the citizens on the scale of actual satisfaction with life in every one of the 63 countries surveyed”.
──
한국 응답자 특성표